GUI
Table of Contents

1. Streamlit
Streamlit 是一個開源的 Python 庫,專為數據科學家、機器學習工程師和開發者設計,能夠快速構建美觀且功能強大的網頁應用程式。它最大的優勢在於不需要複雜的前端開發技術,只需用簡單的 Python 代碼即可生成互動式的網頁應用。Streamlit 常被用於展示數據分析結果、機器學習模型或交互式儀表板。
1.1. 特點:
- 簡單易用:只需要使用 Python 代碼,無需學習 HTML、CSS 或 JavaScript 等前端技術。
- 快速開發:用戶可以在幾分鐘內從數據分析轉變成一個全功能的網頁應用,適合快速開發與迭代。
- 實時互動:用戶可以通過滑桿、下拉選單等組件與數據進行交互,實時更新視覺化結果。
- 即時更新:任何對代碼的變更在保存後會自動刷新網頁,允許用戶快速查看變化。
1.2. 適用場景:
- 數據展示與可視化:簡單地展示數據分析結果,通過圖表和文字解說進行報告。
- 機器學習應用展示:使用 Streamlit 可以輕鬆將機器學習模型包裝成一個可操作的網頁工具,讓非技術人員也能進行模型預測。
- 交互式儀表板:創建類似於 BI(商業智能)的儀表板,用於動態數據的展示與控制。
1.3. 開發環境設定(本機)
建議在自己的電腦上開發 Streamlit 應用,這是最簡單、最穩定的方式。
1.3.1. 1. 安裝套件
在 PyCharm 或 VS Code 的終端機輸入:
1: pip3 install streamlit
1.3.2. 2. 建立程式檔案
新增一個 Python 檔案,檔名先叫 =main.py=,輸入下列程式並存檔:
1: import streamlit as st
2:
3: st.title('測試python的web玩具')
1.3.3. 3. 執行
在終端機輸入以下指令,瀏覽器會自動開啟:
1: streamlit run main.py
程式修改後存檔,網頁會自動重新載入,不需要重新執行指令。
1.3.4. 結果
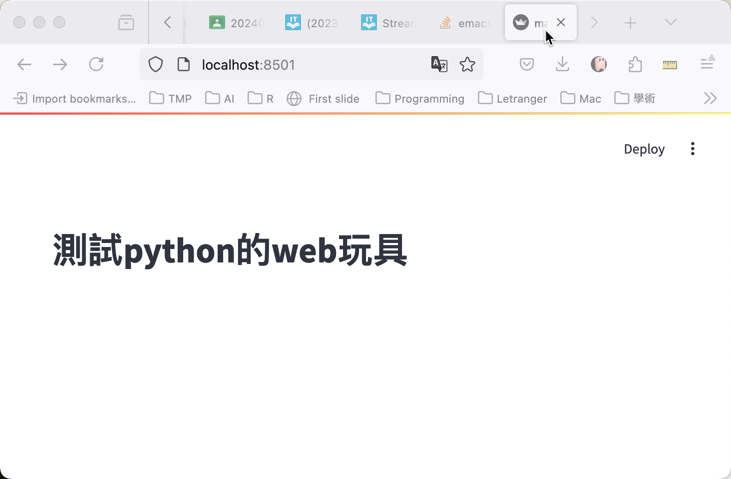
Figure 1: Streamlit 執行畫面
1.4. 替代方案:在 Google Colab 中執行 Streamlit
如果你的電腦無法安裝 Python 環境,可以用 Google Colab 來開發 Streamlit 應用。但由於 Colab 不支援直接開啟網頁服務,需要透過 localtunnel 將應用暴露到網路上,步驟較繁瑣,建議*優先使用本機開發*。
1.4.1. Step 1:安裝套件
1: !pip install streamlit -q
1.4.2. Step 2:撰寫程式
使用 %%writefile 將程式碼寫入檔案:
這裡用到了 st.number_input() 來讓使用者輸入數字:
st.number_input(label, min_value=None, max_value=None, value=0, step=1)
| 參數 | 說明 |
|---|---|
label |
顯示在輸入框上方的文字 |
min_value |
最小值限制(預設 None 不限制) |
max_value |
最大值限制(預設 None 不限制) |
value |
預設值(預設為 0) |
step |
每次增減的步長(整數預設 1、浮點數預設 0.01) |
1: %%writefile app.py
2: import streamlit as st
3: st.write('#Streamlit計算機')
4: num1 = st.number_input('數字1')
5: num2 = st.number_input('數字2')
6: num3 = num1 + num2
7: st.write('#答案', num3)
1.4.3. Step 3:執行並取得公開網址
1: !streamlit run app.py & npx localtunnel --port 8501
執行後會產生一個 xxx.loca.lt 的網址,點擊即可開啟你的應用。
原理說明:
&讓streamlit run在背景執行,不阻擋後面的指令npx localtunnel --port 8501把 Colab 內部的 8501 port 暴露到網路上,產生一個臨時的公開網址- 這個網址是暫時的,Colab 斷線後就會失效
1.5. 秀資料
學生成績
 1: import streamlit as st
 2: import pandas as pd
 3:
 4: st.title('學生成績')
 5:
 6: df = pd.DataFrame({
 7:     '國文': [98, 76, 100, 38, 40],
 8:     '數學': [80, 46, 80, 67, 66]
 9: })
10: df
11:
12: # 畫圖
13: st.line_chart(df)
1.6. 文字輸入與核取方塊
st.text_input 用來接收使用者輸入的文字,=st.checkbox= 則是一個簡單的開關:
 1: import streamlit as st
 2: import pandas as pd
 3:
 4: st.title('學生成績查詢')
 5:
 6: df = pd.DataFrame({
 7:     '姓名': ['小明', '小華', '小美', '小強', '小玉'],
 8:     '國文': [98, 76, 100, 38, 40],
 9:     '數學': [80, 46, 80, 67, 66]
10: })
11:
12: # 文字輸入:搜尋學生
13: name = st.text_input('輸入學生姓名')
14: if name:
15:     result = df[df['姓名'].str.contains(name)]
16:     st.dataframe(result)
17:
18: # 核取方塊:顯示/隱藏原始資料
19: if st.checkbox('顯示全部資料'):
20:     st.dataframe(df)
1.7. 在 Streamlit 中使用 Matplotlib
前面學過的 matplotlib 圖表,可以用 st.pyplot(fig) 直接放進 Streamlit。重點是要先建立 fig 物件,再丟給 =st.pyplot()=:
 1: import streamlit as st
 2: import pandas as pd
 3: import matplotlib.pyplot as plt
 4:
 5: plt.rcParams['font.sans-serif'] = ['Arial Unicode MS']
 6: plt.rcParams['axes.unicode_minus'] = False
 7:
 8: st.title('成績分佈')
 9:
10: df = pd.DataFrame({
11:     '國文': [98, 76, 100, 38, 40, 85, 72, 91],
12:     '數學': [80, 46, 80, 67, 66, 55, 88, 73]
13: })
14:
15: # 用 matplotlib 畫圖,再用 st.pyplot() 顯示
16: fig, ax = plt.subplots()
17: ax.hist(df['國文'], bins=range(0, 101, 10), rwidth=0.8)
18: ax.set_xlabel('分數')
19: ax.set_ylabel('人數')
20: ax.set_title('國文成績分佈')
21: st.pyplot(fig)
1.8. 上傳檔案
st.file_uploader 讓使用者上傳 CSV 檔案,搭配 pandas 就能做出「上傳資料→分析→視覺化」的完整流程:
 1: import streamlit as st
 2: import pandas as pd
 3:
 4: st.title('CSV 資料分析器')
 5:
 6: uploaded_file = st.file_uploader("上傳 CSV 檔案", type="csv")
 7:
 8: if uploaded_file is not None:
 9:     df = pd.read_csv(uploaded_file)
10:     st.write(f'共 {len(df)} 筆資料,{len(df.columns)} 個欄位')
11:     st.dataframe(df)
12:
13:     # 讓使用者選擇要看哪個欄位的統計
14:     numeric_cols = df.select_dtypes(include='number').columns.tolist()
15:     if numeric_cols:
16:         col = st.selectbox('選擇欄位查看統計', numeric_cols)
17:         st.write(df[col].describe())
18: else:
19:     st.info('請上傳一個 CSV 檔案')
1.9. 版面配置
預設的 Streamlit 畫面是由上到下一條直線排列。用 st.columns 可以做出左右並排的版面,用 st.tabs 可以做出分頁效果:
1.9.1. 左右並排 (columns)
 1: import streamlit as st
 2: import pandas as pd
 3:
 4: st.title('版面示範')
 5:
 6: df = pd.DataFrame({
 7:     '國文': [98, 76, 100, 38, 40],
 8:     '數學': [80, 46, 80, 67, 66]
 9: })
10:
11: # 建立兩個欄位,左右並排
12: col1, col2 = st.columns(2)
13:
14: with col1:
15:     st.subheader('國文成績')
16:     st.dataframe(df[['國文']])
17:
18: with col2:
19:     st.subheader('數學成績')
20:     st.dataframe(df[['數學']])
1.9.2. 分頁 (tabs)
 1: import streamlit as st
 2: import pandas as pd
 3: import matplotlib.pyplot as plt
 4:
 5: plt.rcParams['font.sans-serif'] = ['Arial Unicode MS']
 6: plt.rcParams['axes.unicode_minus'] = False
 7:
 8: st.title('成績系統')
 9:
10: df = pd.DataFrame({
11:     '國文': [98, 76, 100, 38, 40],
12:     '數學': [80, 46, 80, 67, 66]
13: })
14:
15: tab1, tab2, tab3 = st.tabs(["原始資料", "統計摘要", "圖表"])
16:
17: with tab1:
18:     st.dataframe(df)
19:
20: with tab2:
21:     st.write(df.describe())
22:
23: with tab3:
24:     fig, ax = plt.subplots()
25:     df.plot(kind='box', ax=ax)
26:     ax.set_title('各科成績箱形圖')
27:     st.pyplot(fig)
1.10. 顯示圖片
st.image 可以顯示本機圖片或網路圖片:
1: import streamlit as st
2:
3: # 顯示網路圖片
4: st.image("https://www.python.org/static/img/python-logo.png",
5:          caption="Python Logo", width=300)
1.11. 常用元件速查表
以下整理 Streamlit 常用元件,方便做專題時快速查找:
| 元件 | 用途 | 範例 |
|---|---|---|
st.title |
大標題 | st.title('我的應用') |
st.write |
萬用輸出 | st.write(df), st.write('文字') |
st.dataframe |
互動式表格 | st.dataframe(df) |
st.text_input |
文字輸入 | name = st.text_input('姓名') |
st.number_input |
數字輸入 | n = st.number_input('數量') |
st.selectbox |
下拉選單 | opt = st.selectbox('選擇', ['A','B']) |
st.checkbox |
核取方塊 | if st.checkbox('顯示'): |
st.slider |
滑桿 | val = st.slider('值', 0, 100, 50) |
st.radio |
單選按鈕 | r = st.radio('選擇', ['甲','乙']) |
st.file_uploader |
上傳檔案 | f = st.file_uploader('上傳', type’csv’)= |
st.image |
顯示圖片 | st.image('photo.png') |
st.pyplot |
顯示 matplotlib | st.pyplot(fig) |
st.line_chart |
快速折線圖 | st.line_chart(df) |
st.bar_chart |
快速長條圖 | st.bar_chart(df) |
st.map |
地圖 | st.map(df) |
st.sidebar |
側邊欄 | st.sidebar.write('Hi') |
st.columns |
左右並排 | c1, c2 = st.columns(2) |
st.tabs |
分頁 | t1, t2 = st.tabs(['頁1','頁2']) |
st.camera_input |
拍照 | img = st.camera_input('拍照') |
1.12. 側邊欄 (Sidebar)
1.12.1. 測試一下
 1: import streamlit as st
 2: import pandas as pd
 3:
 4: st.title('學生成績')
 5: st.write('lalala')
 6: # 數據
 7: df = pd.DataFrame({
 8:     '國文': [98, 76, 100, 38, 40],
 9:     '數學': [80, 46, 80, 67, 66]
10: })
11:
12: st.sidebar.write('選項1')
13: st.sidebar.markdown('選項2')
14: with st.sidebar:
15:     st.write('選項3')
16:
17: df
1.12.2. 練習
- 請自行在sidebar和main area裡加入一些文字
- 可以發現sidebar是可以接受markdown語法的,那麼,你能否應用markdown語法在sidebar裡放一個google的連結呢?
1.13. 選單
1.13.1. 連結式選單
 1: import streamlit as st
 2: import pandas as pd
 3:
 4: st.title('學生成績')
 5:
 6: # 數據
 7: df = pd.DataFrame({
 8:     '國文': [98, 76, 100, 38, 40],
 9:     '數學': [80, 46, 80, 67, 66]
10: })
11:
12: # 側邊欄連結
13: st.sidebar.markdown("[查看數據](?page=table)")
14: st.sidebar.markdown("[畫圖](?page=chart)")
15:
16: # 獲取當前URL參數
17: query_params = st.query_params
18: page = query_params.get("page", "table")
19:
20: # 根據URL參數顯示相應的內容
21: if page == 'table':
22:     st.write('學生成績數據表')
23:     st.dataframe(df)
24: elif page == 'chart':
25:     st.write('學生成績折線圖')
26:     st.line_chart(df)
1.13.2. 下拉式選單
 1: import streamlit as st
 2: import pandas as pd
 3: import matplotlib.pyplot as plt
 4:
 5: st.title('學生成績')
 6:
 7: # 數據
 8: df = pd.DataFrame({
 9:     '國文': [98, 76, 100, 38, 40],
10:     '數學': [80, 46, 80, 67, 66]
11: })
12:
13: # 側邊欄選擇
14: st.sidebar.write('選單')
15: option = st.sidebar.selectbox(
16:     '請選擇操作',
17:     ['查看成績', '畫折線圖']
18: )
19:
20: # 根據選擇顯示相應的內容
21: if option == '查看成績':
22:     st.write('學生成績表')
23:     st.dataframe(df)
24: elif option == '畫折線圖':
25:     st.write('學生成績折線圖')
26:     fig, ax = plt.subplots()
27:     ax.plot(df['國文'])
28:     ax.plot(df['數學'])
29:     ax.set_xticks(range(5))
30:     ax.set_xticklabels(range(1, len(df) + 1))
31:     st.pyplot(fig)
1.13.3. 課堂練習
請參考Google Classroom中的[實作練習7]更專業的資料處理工具: Pandas,新增三種選單功能
- 查看全班成績
- 國文科成績長條圖
- 各科Box圖
- 請解決畫圖時中文出現亂碼的問題
- 請善用ChatGPT
完成結果參考下圖:
.gif)
1.14. 地圖
1.14.1. 單一地標
 1: import streamlit as st
 2: import pandas as pd
 3:
 4: st.title('雲林智慧教育中心')
 5:
 6: data = pd.DataFrame({
 7:     'lat': 23.67,
 8:     'lon': 120.39,
 9:     'name': ['雲林智慧教育中心']
10: })
11:
12: st.map(data)
1.14.2. 兩個或以上地標
 1: import streamlit as st
 2: import pandas as pd
 3:
 4: st.title('雲林')
 5: # 定義不同地點的數據
 6: locs = {
 7:     '雲林智慧教育中心': {'lat': 23.67, 'lon': 120.39},
 8:     '雲林高鐵站': {'lat': 23.738, 'lon': 120.428}
 9: }
10:
11: data = pd.DataFrame([
12:     {'lat': locs['雲林智慧教育中心']['lat'], 'lon': locs['雲林智慧教育中心']['lon'], 'name': '雲林智慧教育中心'},
13:     {'lat': locs['雲林高鐵站']['lat'], 'lon': locs['雲林高鐵站']['lon'], 'name': '雲林高鐵站'}
14: ])
15:
16: st.map(data)
17:
1.14.3. 加入選單
 1: import streamlit as st
 2: import pandas as pd
 3:
 4: st.title('雲林智慧教育中心')
 5: # 定義不同地點的數據
 6: locations = {
 7:     '雲林智慧教育中心': {'lat': 23.67, 'lon': 120.39},
 8:     '雲林高鐵站': {'lat': 23.738, 'lon': 120.428}
 9: }
10:
11: # 在側邊欄中選擇地點
12: st.sidebar.write('選單')
13: option = st.sidebar.selectbox(
14:     '請選擇地點',
15:     ['雲林智慧教育中心', '雲林高鐵站'])
16:
17: # 根據選擇的地點更新地圖數據
18: selected_location = locations[option]
19: data = pd.DataFrame({
20:     'lat': [selected_location['lat']],
21:     'lon': [selected_location['lon']],
22:     'name': [option]
23: })
24: selected_location['lat']
25: selected_location['lon']
26: option
27:
28: st.map(data)
1.14.4. 課堂練習
- 請加入你家的地圖
- 請加入和你學校的地圖
1.15. 照相
 1: import streamlit as st
 2:
 3: # 取得由相機輸入的影像緩衝資料
 4: imgBuffer = st.camera_input("拍照")
 5:
 6: if imgBuffer is not None:
 7:     # 將緩衝資料轉換為二進位資料
 8:     imgData = imgBuffer.getvalue()
 9:
10:     # 儲存到目前資料夾(請依需求修改路徑)
11:     with open("captured_image.png", "wb") as f:
12:         f.write(imgData)
13:
14:     st.success("影像成功儲存!")
1.16. 部署應用程式 (Deploy your app)
做完專題後,你可以把 Streamlit 應用發佈到網路上,讓老師和同學都能直接用瀏覽器打開你的作品。這是交作業和展示成果的最佳方式。
1.16.1. Step 1:準備檔案
你的專案資料夾至少需要兩個檔案:
my-project/
├── app.py               ← 你的 Streamlit 主程式
└── requirements.txt      ← 列出所需套件
requirements.txt 的內容就是你的程式有 import 的套件名稱,例如:
1: streamlit
2: pandas
3: matplotlib
如果你的程式有用到 CSV 資料檔,也一起放進資料夾。
1.16.2. Step 2:上傳至 GitHub
- 登入 GitHub(沒有帳號的先註冊一個)
- 點右上角「+」→「New repository」,取個名字(例如 =my-streamlit-app=)
- 把
app.py和requirements.txt上傳到這個 repository
1.16.3. Step 3:部署到 Streamlit Community Cloud
- 前往 Streamlit Community Cloud,用 GitHub 帳號登入
- 點選「New app」
- 選擇你的 repository、branch(通常是 =main=)、主程式檔案(=app.py=)
- 點選「Deploy」,等待約 1-2 分鐘
- 部署完成後會取得一個公開網址(例如 =https://你的名字-app.streamlit.app=),任何人都能打開
1.16.4. 注意事項
- Streamlit Community Cloud 是免費的,但每個帳號有數量限制
- 如果程式有修改,push 到 GitHub 後會自動重新部署
- 資料檔案不要太大(建議 < 50MB),大檔案改用網路 URL 讀取
1.17. 研習用範例
1.17.1. 需要先在本機端安裝的套件
1: pip3 install pandas
2: pip3 install streamlit
3: pip3 install plotly
4: pip3 install scikit-learn
1.17.2. 範例程式
 1: import pandas as pd
 2: import streamlit as st
 3: import plotly.express as px
 4: from sklearn.cluster import KMeans
 5:
 6: # 讀取資料
 7: test = pd.read_csv("https://letranger.github.io/working/scores.csv")
 8:
 9: # Streamlit 應用程式標題
10: st.title("分數分佈")
11:
12: # 設定側邊欄選單
13: st.sidebar.write('選單')
14:
15: # 科目選擇下拉選單
16: option = st.sidebar.selectbox(
17:     '請選擇科目',
18:     ['國文', '英文', '數學', '物理']
19: )
20:
21: # 顯示資料框
22: st.write("### 資料", test)
23:
24: # 將分數依每10分分一組
25: test['binned'] = pd.cut(test[option], bins=range(0, 101, 10))
26:
27: # 計算每個區間的頻率
28: frequency = test['binned'].value_counts().sort_index()
29: # 轉換為資料框格式,方便 Streamlit 顯示
30: frequency_df = pd.DataFrame({'分數區間': frequency.index.astype(str), '頻率': frequency.values})
31:
32: # 使用 Streamlit 顯示長條圖
33: st.bar_chart(frequency_df.set_index('分數區間'))
34:
35: # KMeans 聚類
36: # 使用滑桿選擇 k 值(聚類數量)
37: k = st.slider("選擇聚類的數量 k", 2, 10, 3)
38: kmeans = KMeans(n_clusters=k)  # 預設分為 k 群
39: kmeans.fit(test[['國文', '英文']])  # 使用 '國文' 和 '英文' 進行聚類
40: clusters = kmeans.predict(test[['國文', '英文']])
41:
42: # 將聚類結果添加到資料框
43: test['聚類'] = clusters
44:
45: # 使用 Plotly 繪製聚類結果的散點圖
46: fig2 = px.scatter(test, x='國文', y='英文', color='聚類', title='國文與英文分數的聚類結果')
47: st.plotly_chart(fig2)
2. Gradio
前面學了 Streamlit,這裡再介紹另一個 Web GUI 工具 Gradio。兩者的差異:
| 工具 | 適合場景 |
|---|---|
| Streamlit | 資料儀表板、多頁面的資料展示應用 |
| Gradio | 「輸入→處理→輸出」的 demo,特別適合 AI 模型展示 |
簡單來說,如果你的程式是「丟東西進去、吐結果出來」的型態,Gradio 會比 Streamlit 更快上手。
2.1. 安裝套件
1: pip3 install gradio
2.2. Hello world1
gr.Interface 是 Gradio 最核心的類別,把一個 Python 函式包裝成網頁介面:
gr.Interface(fn, inputs, outputs, title=None, description=None)
| 參數 | 說明 |
|---|---|
fn |
被 UI 裝飾的函式 |
inputs |
輸入元件,可用字串簡寫如 "text", "image", "audio" |
outputs |
輸出元件,可用字串簡寫如 "text", "image", "label" |
title |
網頁標題(顯示在最上方) |
description |
標題下方的說明文字 |
多個輸入/輸出用 list 傳入,例如 inputs[“text”, “number”]=。Gradio 支援 20 多種不同的元件型別,其中大部分都可以作為輸入/輸出元件,詳見官網文件gradio Docs
1: import gradio as gr
2:
3: def greet(name):
4:     return "Hello " + name + "!!"
5:
6: demo = gr.Interface(fn=greet, inputs="text", outputs="text")
7:
8: demo.launch()
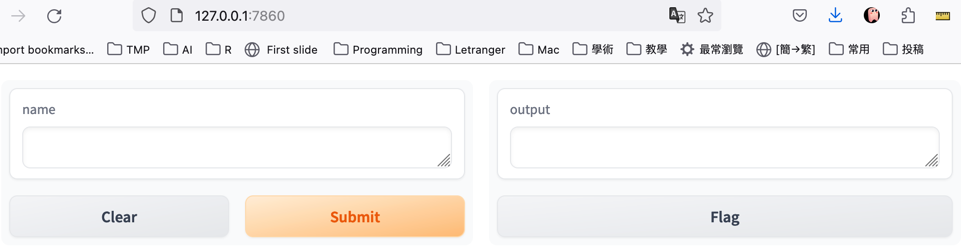
Figure 3: 執行畫面
2.3. 數字 I/O
這裡用 gr.Slider 當作數字輸入元件,比起手動打數字方便多了:
gr.Slider(minimum=0, maximum=100, value=50, step=1, label=None)
| 參數 | 說明 |
|---|---|
minimum |
滑桿最小值(預設 0) |
maximum |
滑桿最大值(預設 100) |
value |
預設值(預設 50) |
step |
每次滑動的步長(預設 1) |
label |
顯示在滑桿上方的標籤文字 |
 1: import gradio as gr
 2:
 3: def BMI(h, w):
 4:   h /= 100
 5:   return f'BMI值: {w/(h*h)}'
 6:
 7: ui = gr.Interface(
 8:     fn=BMI, inputs=[gr.Slider(100, 240, label="身高(cm)"), gr.Slider(40, 200, label="體重(kg)")],
 9:     outputs=["text"]
10: )
11: ui.launch(share=True)
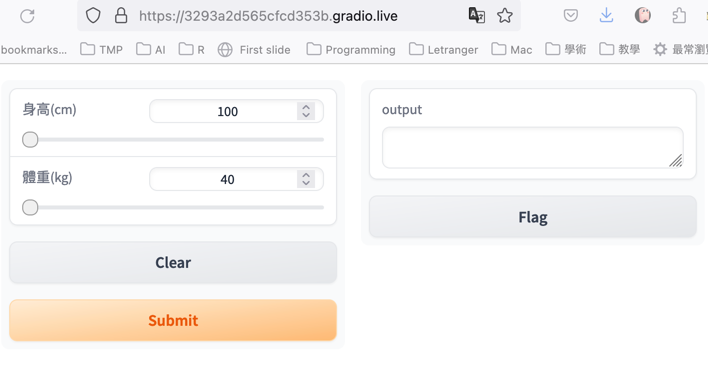
Figure 4: 執行畫面
2.3.1. [課堂練習]三角形面積 TNFSH
輸入三角形三邊長(1..100),輸出面積、周長
2.4. 文字 I/O
 1: import gradio as gr
 2:
 3: def greet(name):
 4:     return "Hello " + name + "!"
 5:
 6: demo = gr.Interface(
 7:     fn=greet,
 8:     inputs=gr.Textbox(lines=2, placeholder="Name Here..."),
 9:     outputs="text",
10: )
11: demo.launch(share=True)
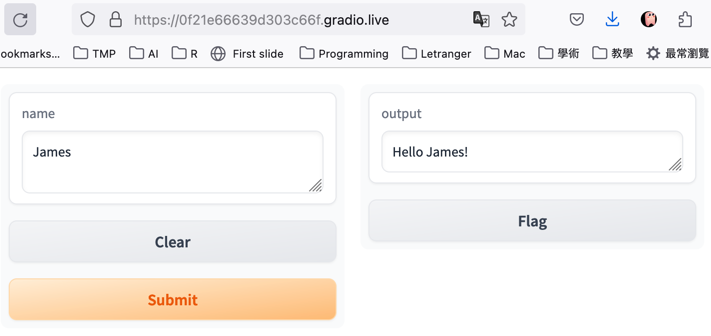
Figure 5: 執行畫面
2.5. 多資料 I/O
 1: import gradio as gr
 2:
 3: def greet(name, is_morning, temperature):
 4:     salutation = "Good morning" if is_morning else "Good evening"
 5:     greeting = f"{salutation} {name}. It is {temperature} degrees today"
 6:     celsius = (temperature - 32) * 5 / 9
 7:     return greeting, round(celsius, 2)
 8:
 9: demo = gr.Interface(
10:     fn=greet,
11:     inputs=["text", "checkbox", gr.Slider(0, 100)],
12:     outputs=["text", "number"],
13: )
14: demo.launch(share=True)
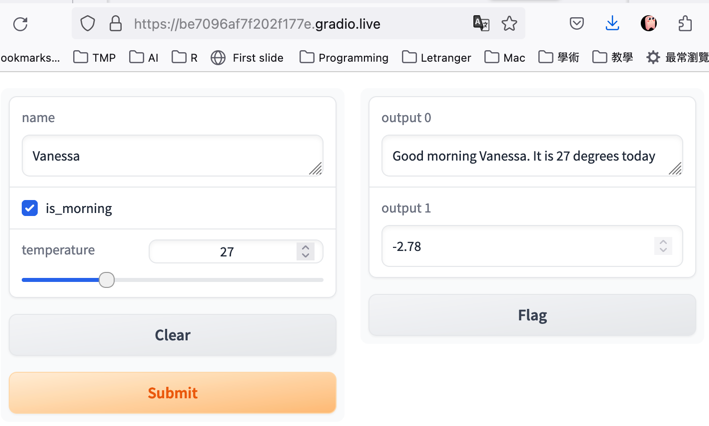
Figure 6: 執行畫面
2.6. 圖形 I/O
 1: import gradio as gr
 2: import matplotlib.pyplot as plt
 3: import numpy as np
 4: def curve(a, b, c):
 5:     x = np.arange(-3, 3, 0.3)
 6:     y = a*x**2 + b*x + c
 7:     fig = plt.figure()
 8:     plt.plot(x, y)
 9:     print(x)
10:     print(y)
11:     return fig
12: inputs = [gr.Slider(0, 10, 5), gr.Slider(0, 10, 5), gr.Slider(0, 10, 5)]
13: outputs = gr.Plot()
14: demo = gr.Interface(
15:     fn=curve,
16:     inputs=inputs,
17:     outputs=outputs,
18:     cache_examples=True,)
19: demo.launch(share=True)
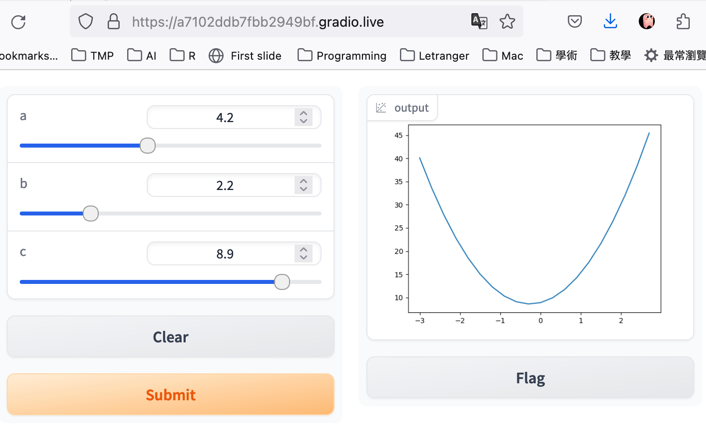
Figure 7: 執行畫面
2.7. 按鈕 (Button)
前面的 gr.Interface 適合「一進一出」的簡單情境,如果需要自訂版面配置(例如自己決定元件排列方式),就要用 =gr.Blocks=:
with gr.Blocks() as demo:
- 在
with區塊裡面放元件,就會按順序排列 - 搭配
gr.Row(),gr.Column()可以做水平/垂直排列 - 用
btn.click(fn=函式, inputs…, outputs=…)= 綁定按鈕事件
 1: import gradio as gr
 2:
 3: def greet(name):
 4:     return "Hello " + name + "!"
 5:
 6: with gr.Blocks() as demo:
 7:     name = gr.Textbox(label="Name")
 8:     output = gr.Textbox(label="Output Box")
 9:     greet_btn = gr.Button("Greet")
10:     greet_btn.click(fn=greet, inputs=name, outputs=output)
11:
12: demo.launch(share=True)
Figure 8: 執行畫面
2.8. Radio
 1: import gradio as gr
 2:
 3: def greet(gender, name):
 4:     if gender == "Male":
 5:         return "Hello, Mr. " + name + "!"
 6:     else:
 7:         return "Hello, Ms. " + name + "!"
 8:
 9: with gr.Blocks() as demo:
10:     inputs = [gr.Radio(["Male", "Female"]), gr.Textbox(label="Name")]
11:     output = gr.Textbox(label="Output Box")
12:     greet_btn = gr.Button("Greet")
13:     greet_btn.click(fn=greet, inputs=inputs, outputs=output)
14:
15: demo.launch(share=True)
Figure 9: 執行畫面
2.9. Tab(分頁)
適合多功能的程式(靜態的多重輸入)
 1: import gradio as gr
 2:
 3: def tri(a, b, c):
 4:     import math
 5:     # 使用海龍公式計算半周長
 6:     s = (a + b + c) / 2
 7:     # 使用半周長計算面積
 8:     area = math.sqrt(s * (s - a) * (s - b) * (s - c))
 9:     return round(area,2)
10:
11: def rect(a, b):
12:     return round(a*b,2)
13:
14: area1 = gr.Interface(
15:     tri,
16:     [gr.Slider(label="長"), gr.Slider(label="寬"), gr.Slider(label="高") ],
17:     gr.Number(label="面積"),
18: )
19:
20: area2 = gr.Interface(
21:     rect,
22:     [ gr.Slider(label="長"), gr.Slider(label="寬") ],
23:     gr.Number(label="面積"),
24: )
25:
26: gr.TabbedInterface(
27:     [area1, area2], ["三角形", "長方形"]
28: ).launch()
Figure 10: 分頁式的Gradio
3. Flask
3.1. 按鈕 (Button)
Flask 用 @app.route() 裝飾器把 URL 路徑對應到 Python 函式:
@app.route(rule, methods[’GET’])=
| 參數 | 說明 |
|---|---|
rule |
URL 路徑,如 "/"=、“/page”= |
methods |
允許的 HTTP 方法,如 ['GET', 'POST'] |
rule 中可用 <variable> 接收 URL 參數,例如 @app.route("/user/<name>") 會把網址中的值傳給函式參數 =name=。
 1: from flask import Flask
 2: app = Flask(__name__)
 3:
 4: @app.route("/")
 5: def hello():
 6:     title = "<title>Advanced Materials of Python</title>"
 7:     h1 = "<h1>Python based web</h1>"
 8:     p1 = "<p>這是用Python開發的網站</p>"
 9:     return title+h1+p1
10:
11: if __name__ == "__main__":
12:     app.run()
Figure 11: Flask Web Site
3.2. 輸入表單 (Input form)2
Figure 12: 執行畫面
3.2.1. Python
這個範例用到了 render_template() 來載入 HTML 模板:
render_template(template_name, **context)
| 參數 | 說明 |
|---|---|
template_name |
模板檔名,如 "index.html" |
**context |
要傳給模板的變數,用關鍵字參數傳入 |
注意事項:
- 模板檔案須放在
templates/資料夾裡(Flask 預設路徑) - 傳入的變數可在模板中用 ={{ variable }}= 存取
 1: # Flask網站前後端互動 09 - 超連結與圖片
 2: # 載入Flask、Request、render_template
 3: from flask import Flask, request, render_template
 4:
 5: app = Flask(__name__, template_folder='templates',
 6:             static_folder="public",
 7:             static_url_path="/")
 8:
 9: # 處理路徑 / 的對應函式
10: @app.route("/")
11:
12: def main():
13:     return render_template("index.html")
14:
15: @app.route("/page")
16:
17: def page():
18:     #從main.html頁面中讀取姓名,存在name中
19:     name = request.args.get("nameis")
20:     # 將name的資料轉給page.html中的變數namepage
21:     return render_template("page.html", namepage=name)
22: # 啟動Server
23:
24: if __name__ == '__main__':
25:     app.debug = True  # 開發時方便除錯,正式上線時記得關掉
26:     app.run()
3.2.2. templates
- 建立public資料夾,放入一個head.png圖檔
- 建立templates資料夾
- 以下兩個html檔要放在templates資料夾中
3.2.2.1. index.html
 1: <!DOCTYPE html>
 2: <html lang="en">
 3:
 4: <head>
 5:     <meta charset="UTF-8">
 6:     <meta http-equiv="X-UA-Compatible" content="IE=edge">
 7:     <meta name="viewport" content="width=device-width, initial-scale=1.0">
 8:     <title>這是標題</title>
 9: </head>
10:
11: <body>
12:     <h3>網頁的主畫面</h3>
13:     <form action="/page">
14:         名字:<input type="text" name="nameis">
15:         <button>點擊送出</button>
16:     </form>
17: </body>
18:
19: </html>
3.2.2.2. page.html
<!DOCTYPE html>
<html lang="en">

<head>
    <meta charset="UTF-8">
    <meta http-equiv="X-UA-Compatible" content="IE=edge">
    <meta name="viewport" content="width=device-width, initial-scale=1.0">
    <title>page1</title>

</head>

<body>
    <h1>我的名字叫 {{namepage}}</h1>
</body>

</html>
3.3. [課堂練習]Flask 自我介紹網站 TNFSH
參考上面的 Input form 範例,製作一個簡易的自我介紹網站:
- 首頁(index.html)包含一個表單,讓使用者輸入:
- 姓名(文字輸入)
- 班級(文字輸入)
- 興趣(文字輸入)
- 姓名(文字輸入)
- 點擊送出後,跳到結果頁(result.html),顯示使用者輸入的資料
- 結果頁使用 HTML 標題和段落排版
提示:
- 使用
request.args.get()取得表單資料 - 在
render_template()中傳入多個變數 - HTML 表單的
action屬性指向 Flask 的路由
4. tkinter
4.1. 安裝
4.1.1. MacOS
於PyCharm的terminal下輸入brew install python-tk@Python版本
如果系統的預設python版本為3.9,則輸入
1: brew install python-tk@3.9
2: pip install tk
4.2. 範例 #1
tkinter 的 tk.Button 用來建立按鈕,最重要的是 command 參數:
tk.Button(parent, text’…’, command=callback)=
| 參數 | 說明 |
|---|---|
parent |
父元件(通常是 root 主視窗) |
text |
按鈕上顯示的文字 |
command |
按下按鈕時要執行的函式(不加括號!) |
command 只能綁定「沒有參數的函式」,如果需要傳參數,用 lambda 包一層:
command=lambda: calculate('+')
 1: # -*- coding: utf-8 -*-
 2: import tkinter as tk
 3: from tkinter import messagebox
 4: # 按完button要做什麼
 5: def test():
 6:     tk.messagebox.showinfo('測試', 'Hi')
 7:
 8: # main window
 9: root = tk.Tk()
10: root.title('my window')
11: root.geometry('200x150')
12:
13: root.configure(background='white')
14:
15: myentry = tk.Entry(root)
16: myentry.pack()
17:
18: # Button
19: myButton = tk.Button(root, text='Button', command=test)
20: myButton.pack()
21:
22: # Label
23: resultLabel = tk.Label(root, text='這是Label')
24: resultLabel.pack()
25:
26: root.mainloop()
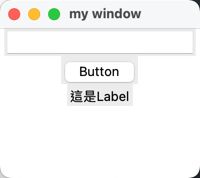
Figure 13: 執行畫面
4.3. 範例 #2
 1: # -*- coding: utf-8 -*-
 2: import tkinter as tk
 3: from tkinter import messagebox
 4:
 5: def button_event():
 6:     #print(var.get())
 7:     if var.get() == '':
 8:         tk.messagebox.showerror('message', '未輸入答案')
 9:     elif var.get() == '2':
10:         tk.messagebox.showinfo('message', '答對了!')
11:     else:
12:         tk.messagebox.showerror('message', '答錯')
13:
14: root = tk.Tk()
15: root.title('my window')
16:
17: # label
18: mylabel = tk.Label(root, text='1+1=')
19: mylabel.grid(row=0, column=0)
20:
21: var = tk.StringVar()
22: myentry = tk.Entry(root, textvariable=var)
23: myentry.grid(row=0, column=1)
24:
25: mybutton = tk.Button(root, text='完成', command=button_event)
26: mybutton.grid(row=1, column=1)
27:
28: root.mainloop()
Figure 14: 執行畫面
4.4. [課堂練習]簡易計算機 TNFSH
參考範例 #1 和 #2,用 tkinter 製作一個簡易計算機,需包含:
- 兩個輸入欄位(Entry)讓使用者輸入數字
- 四個按鈕(+、-、×、÷)
- 一個 Label 顯示計算結果
- 使用 grid 排版
提示:
- 用
tk.Entry取得輸入值,透過.get()讀取並用float()轉型 - 用
tk.Button(root, text’+’, command=函式名)= 建立按鈕 - 用
resultLabel.config(text=結果)更新 Label 文字
完成畫面參考:
- 第一列:「數字1」Label + Entry
- 第二列:「數字2」Label + Entry
- 第三列:四個運算按鈕(+、-、×、÷)
- 第四列:「結果」Label
5. PyInstaller
5.1. 安裝pyinstaller
1: pip3 install pyinstaller
5.2. 準備要打包的檔案
5.2.1. 找一個喜歡的icon
- https://www.iconarchive.com
- mac: icns
- windows: ico
此處我下載了一個icns,命名為imac.icns,與底下的403qq.py存於同一資料夾裡,如果你懶到不想自己找,也可以按這裡下載我的icns圖示檔
5.2.2. 以前述tkinter demo#2為例,將下列程式命名為403qq.py
 1: import tkinter as tk
 2: from tkinter import messagebox
 3:
 4: def button_event():
 5:     #print(var.get())
 6:     if var.get() == '':
 7:         tk.messagebox.showerror('message', '未輸入答案')
 8:     elif var.get() == '2':
 9:         tk.messagebox.showinfo('message', '答對了!')
10:     else:
11:         tk.messagebox.showerror('message', '答錯')
12:
13: root = tk.Tk()
14: root.title('my window')
15:
16: # label
17: mylabel = tk.Label(root, text='1+1=')
18: mylabel.grid(row=0, column=0)
19:
20: var = tk.StringVar()
21: myentry = tk.Entry(root, textvariable=var)
22: myentry.grid(row=0, column=1)
23:
24: mybutton = tk.Button(root, text='完成', command=button_event)
25: mybutton.grid(row=1, column=1)
26:
27: root.mainloop()
5.3. 打包
1: pyinstaller --icon imac.icns --noconsole -n 403QQ 403qq.py
成功執行後,會在同一資料夾中看到一個dist的資料夾,裡面有一支403QQ的應用程式,試著執行看看
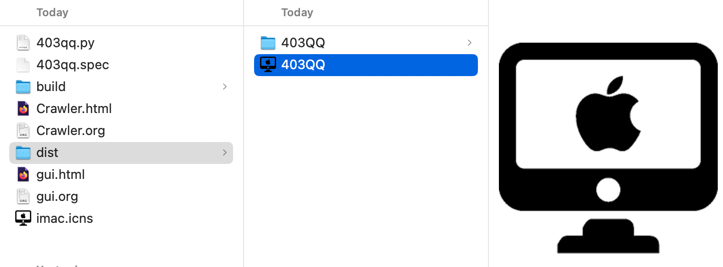
Figure 15: 編譯後的應用程式: 403QQ